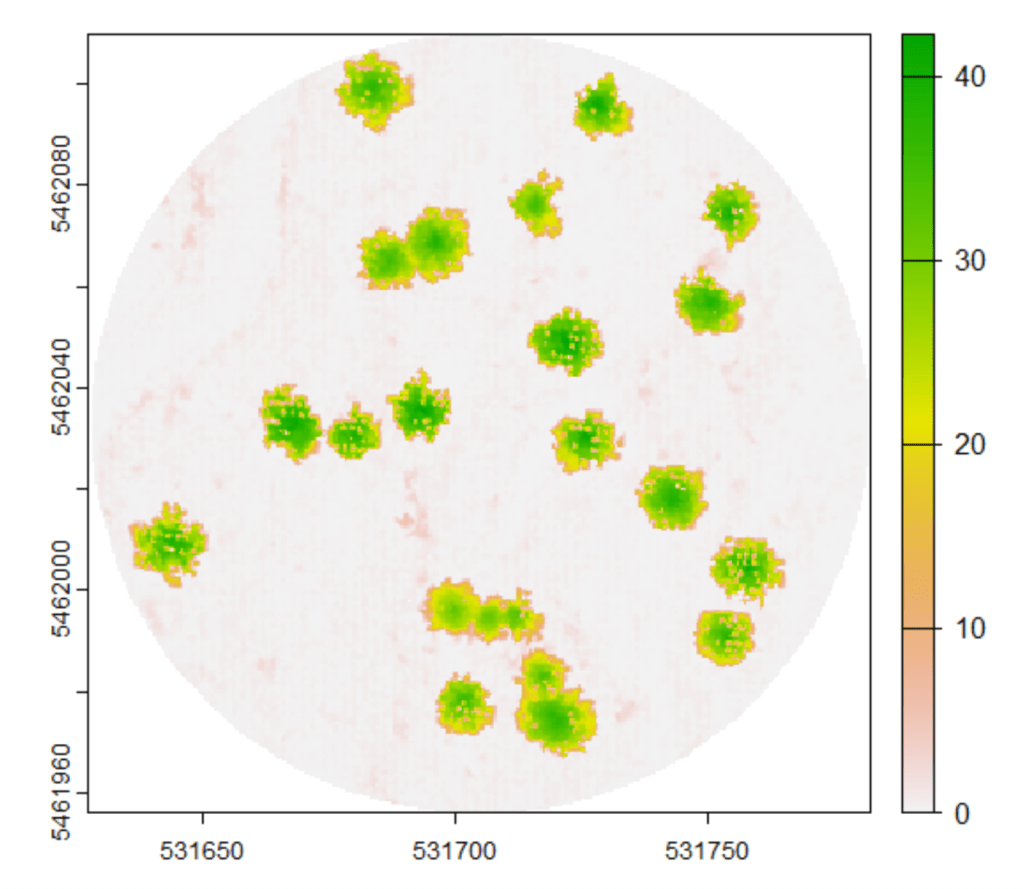
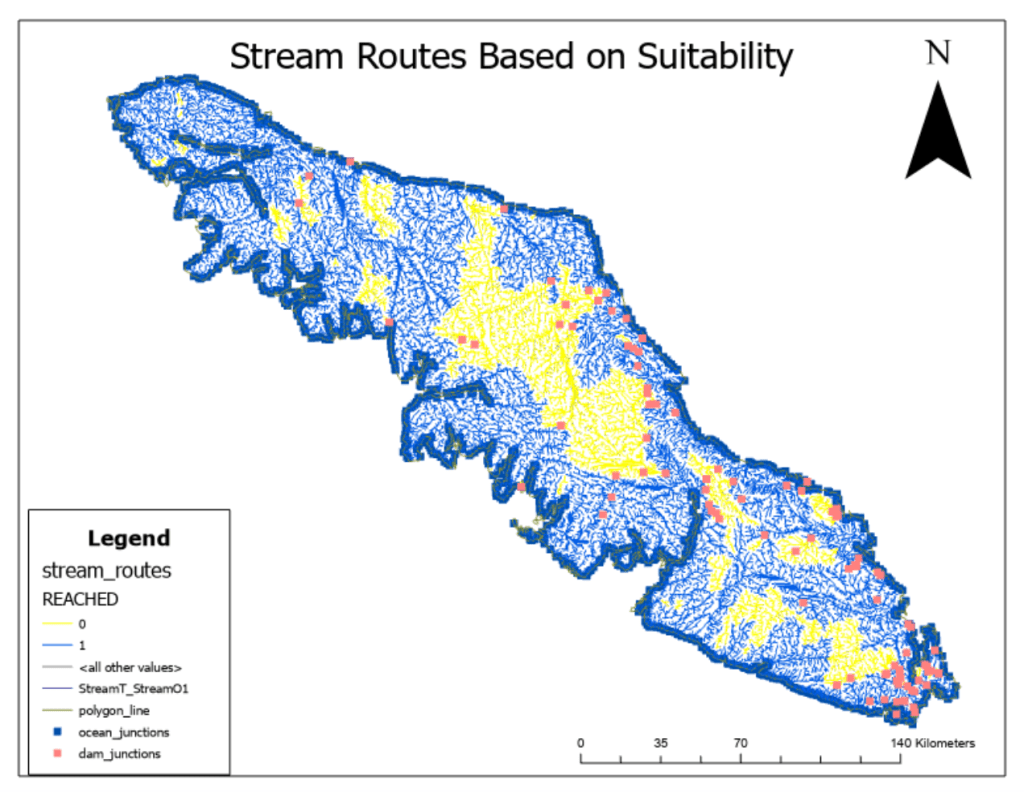
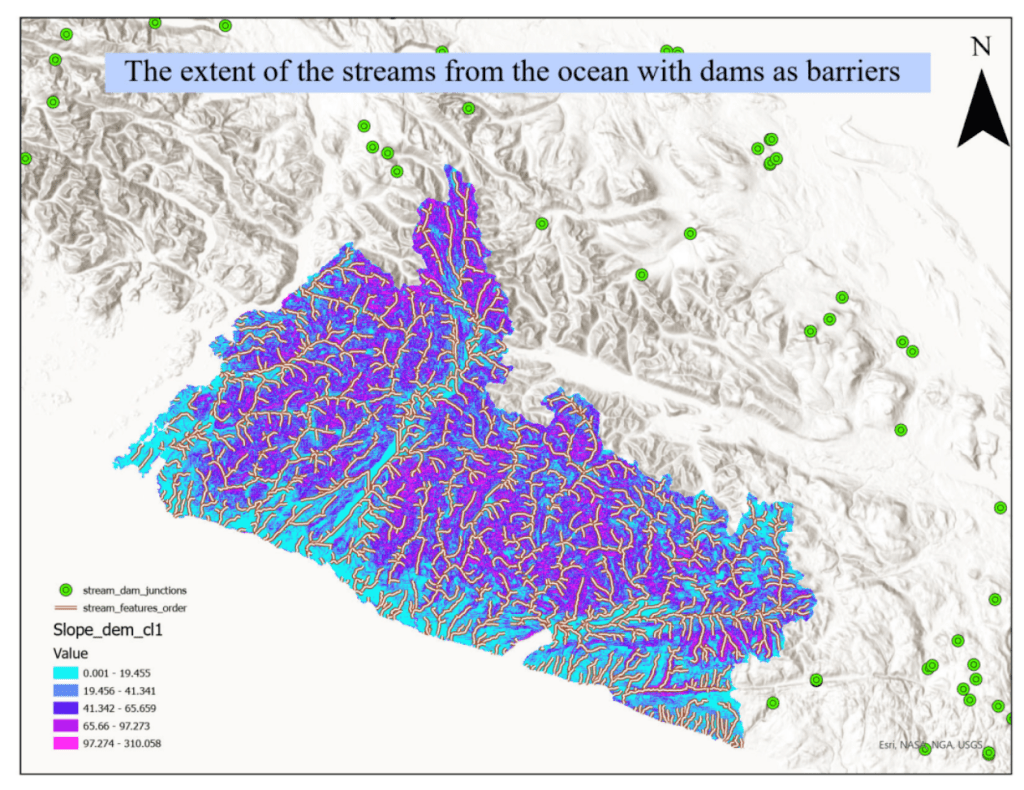
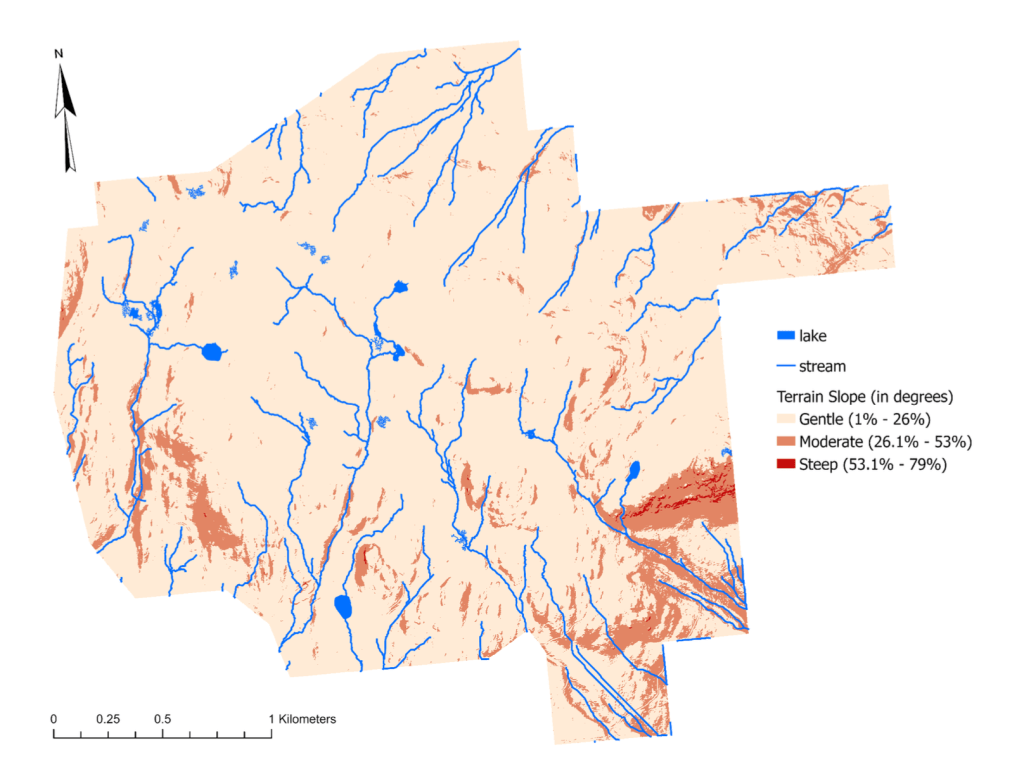
Canopy Height Model of Plot 1 using dalponte2016 algorithm with treetops overlaid.A map delineating ideal stream routes based on suitability for Salmon on Vancouver Island. The yellow lines are deemed unsuitable, and the blue lines are deemed suitable.Delineates the reach of the chosen conservation area showing streams from the ocean with dams as barriers.The Slope of Rose Swanson Mountain is visualized using three classes. Slopes of 1% – 26% were classified as gentle slopes. Slopes of 26.1% – 53% were classified as moderate slopes. Slopes of 53.1% – 79% were classified as steep slopes. Areas with higher slopes that intersect with hydrological features should not be considered for cut blocks.Flow Direction Model (left) and Digital Elevation Model (DEM) (right) of Rose Swanson Mountain. Flow Direction Model delineates which direction water travels across the landscape and the Digital Elevation Model uses 8 classes to identify elevation across the terrain.Illustrates stream order across Rose Swanson Mountain. Pink represents first-order streams, which are the smallest and formed by the convergence of intermittent, transient flow paths. Purple indicates second-order streams, formed by the confluence of two first-order streams. Orange represents third-order streams, which are larger and formed by the convergence of two second-order streams.Projected Topographic Wetness Index (TWI), absence of water is symbolized in blue, wet terrain is symbolized in white. Water bodies, lakes, streams, and ponds, were delineated from dense white patches that indicated a strong water accumulation capability, symbolized in pink.The merged solid water body and stream network based on the flow accumulation process, delineating natural pathways of water and drainage features across the landscape of Rose Swanson Mountain.Stream and lake network of the Rose Swanson recreation area with a 20-metre buffer. The buffer (pink) identifies Hydrologically Sensitive Areas (HSAs) that should be considered when planning cut blocks on Rose Swanson Mountain.The impact of changing Random Forest parameters on the 2nd crown closure model performance was observed through variations in model accuracy, as indicated by R-squared values, mean squared error (MSE), and the variable importance rankings. Parameters such as the number of trees, maximum tree depth, and minimum samples per leaf, should be optimized to improve model performance. Increasing the number of trees generally leads to better model accuracy, as it allows for more comprehensive exploration of the feature space and reduces the risk of overfitting. Similarly, adjusting the maximum tree depth controls the complexity of the model and influences its ability to capture underlying patterns in the data. A higher maximum tree depth may improve model accuracy but increases the risk of overfitting, while a lower value may result in underfitting. Moreover, optimizing the minimum samples per leaf parameter helps balance the trade-off between bias and variance in the model, ensuring robust predictions while avoiding excessive partitioning of the feature space.A plot displaying NDVI of the five averaged spectra (Arbutus, Dead Maple, Fir, Rock, Soil).Plots 1, 2, 3 and 4 segmented with the li2012 algorithm and coloured by treeID.2D Canopy Height Model (CHM) of Alex Fraser Research Forest, British Columbia, Canada.Canopy Height Models of Plot 2 at 0.5m, 2m, 4m and 10m using dalponte2016 algorithm. Displayed with treetops overlaid.3D Canopy Height Model plot (left plot 2D, right plot 3D).2D plot of normalized LiDAR tiles over Malcolm Knapp Research Forest.Figure of display with predicted Class colors visualized over Malcolm Knapp Research Forest.Initial segmentation objects over a composite image of Malcolm Knapp Research Forest.To compare and contrast the influence of different NDVI statistics on predicting vegetation health in Vancouver, I analyzed a set of independent variables encompassing socio-economic and demographic factors. These variables, including household income, education level, population density, and immigration rate, were assessed for their potential impact on NDVI values. Each NDVI statistic, such as total household income, prevalence of low income, and average household size, was individually examined in regression models to determine its efficacy in explaining variations in NDVI. By evaluating coefficients, standard errors, and goodness-of-fit measures across the models, I aimed to identify which NDVI statistic yielded the best model fit. This comprehensive analysis provides insights into the underlying factors shaping green space distribution and vegetation health, informing discussions on environmental equity and sustainable urban development strategies.Map of the watersheds in the Nahmint Region of Vancouver Island, British Columbia.Map showing example stream network and suggested Riparian Management Areas.